We’re constantly testing copy, images, and designs, and measuring their impact on conversions. But sometimes, video gets a “set it and forget it” designation. At Wistia, we’ve been guilty of this oversight from time to time, but recent tests have convinced us to pick up our game. We should be measuring our video’s impact and iterating continuously.

Video is more compelling than anything static on your website. It’s a medium that greatly impacts
how viewers feel about your brand, and it can motivate those viewers to take action. Failing to measure and track its impact is a huge mistake. ### Video onboarding We’re a SaaS company. Without new users, we don’t grow. That’s why we’re constantly asking ourselves, “How can we help our new users be successful?” Throughout onboarding, we aim to connect, teach, and inspire, and
video is a big part of our strategy. We have the benefit of having a lot of new users sign up for Wistia each day, so small tweaks to our signup flow can have big ripples in our business. Lately, we’ve begun to dig into which videos are most effective in motivating our new signups to use Wistia. ### Deciding to test Because we have so many new users every month, we could test and measure the impact in the data relatively quickly. Right after a visitor signs up for Wistia, they’re sent to our “Welcome to Wistia” page:
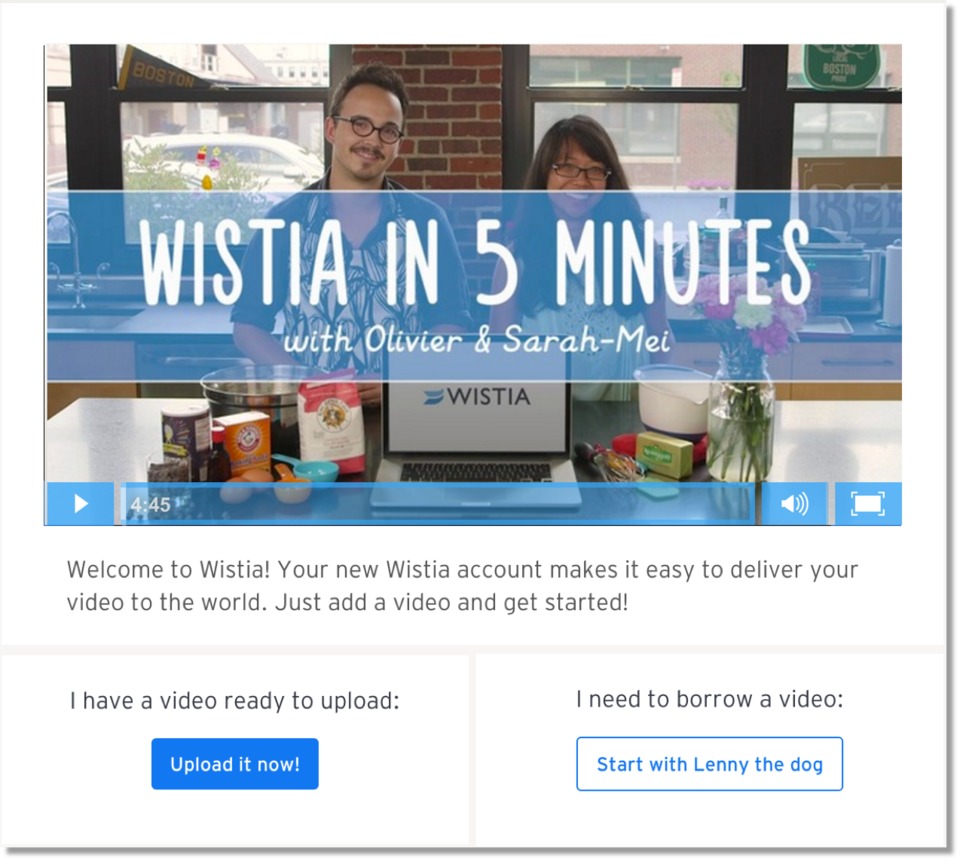
Uploading your first video is the main call to action for new signups. The first version of this page featured the “Wistia in 5 Minutes” demo video. It’s a video that reinforces our value prop, explains our most popular features, and serves as a warm and fun welcome to our software. Overall, the page and the video performed pretty well, but we kept wondering, “Could we inspire more people to use our product with a different video?” #### A data-driven hypothesis The original video on the welcome page was 5 minutes long. We thought the content was super helpful and engaging, but over time, the data suggested otherwise. The video play rate was 18%, and our
engagement rate was 54%.

Additionally, there wasn’t a clear call to action in this video. Since our goal for the page was to get new users to upload their first videos, we decided to experiment with the video content and
add a CTA within the video to improve our conversion rate. Spoiler alert: we were right. But our work was far from done. At an 18% play rate, we weren’t getting enough eyeballs on the video. Normally a 54% engagement rate isn’t too shabby, but we suspected that those who only watched the video up until this point didn’t get the whole message. They were missing a lot of the meat. We had 2 options. We could edit the existing video to create something slightly different, or design something totally different. Usually, drastically different designs produce drastically different results, so we decided to take a home run swing. - We figured that we could increase our engagement rate by creating a shorter video (around 2 minutes). - We decided to swap out our customer success team with our co-founders to underscore the importance of the message. - We added a clear call to action to the end of the video to drive more users to engage.
“Usually, drastically different designs produce drastically different results, so we decided to take a home run swing.”
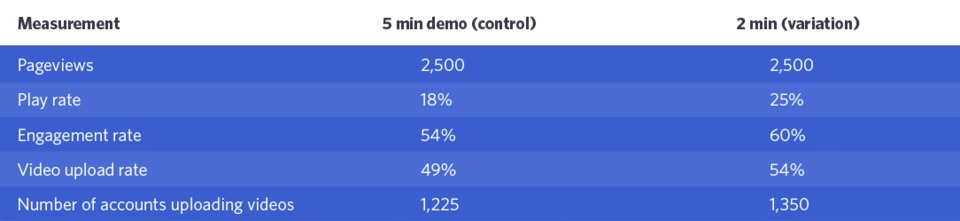
We hypothesized that by making these changes, we could increase the percentage of new users uploading videos by approximately 10%. #### Hypothesized results
### Running the test Based on our hypothesis, we designed a video that was short and sweet (to increase engagement). We also decided to doubly reinforce our main call to action for the page. In addition to including a clickable CTA at the end of the video, we wrote, “so create a new project, and upload your video,” right into the script.
The upload rate was the metric we chose to measure the success of the test. We used the
sample size calculator from Optimizely, and determined how long it would take to run a proper test with a pre-determined confidence interval. Then we showed 50% our new signups the control video (the original) and 50% our variation (the new video). ### Results
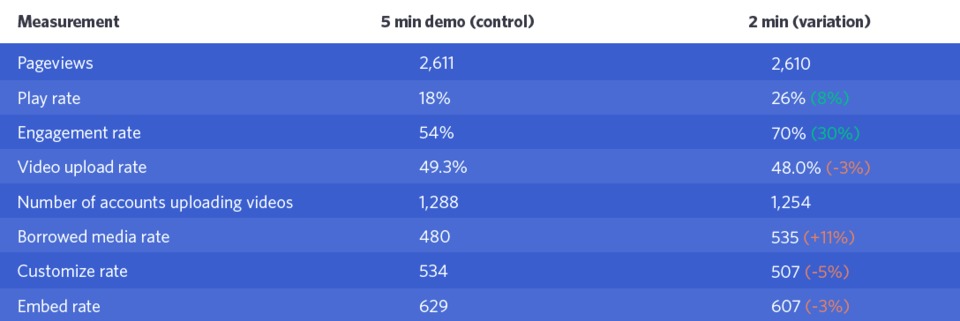
To our surprise, our original video won the test. Our fancy new video actually decreased our uploads by 3%. While a 3% decrease isn’t an earth-shattering loss, it’s definitely not the 10% lift we were hoping for. Interestingly, some parts of our hypothesis were correct. Play rate increased by 8% and our engagement went up a whopping 30%. We were pleased by those results, but those were input metrics. We didn’t achieve our main goal.
“Our fancy new video actually decreased our uploads by 3%.”
#### Taking a deeper dive We were even more shocked when we looked deeper into our app usage for new users who had seen the variation…
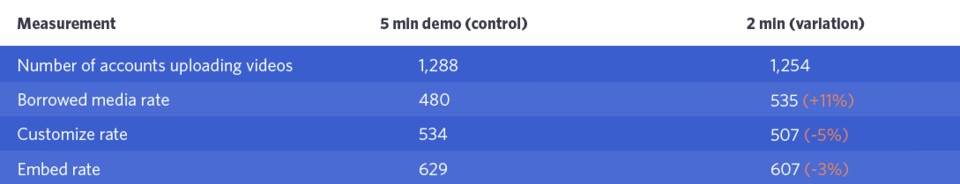
The percentage of users who used the Wistia customize functionality decreased by 5%, and the embed rate decreased by 3%. What a disaster! A 3% decrease might not seem like a lot, but with a high volume of new users, it produces a costly ripple in our business. Less people embedding videos on their website means less active users. Less active users means less potential customers down the road. On the flip side, a 3% increase could represent a significant bump in our revenue per year. ### So, what’d we learn? Our existing 5-minute demo video was more convincing than we thought. Maybe that’s because our new users don’t fully understand all of the Wistia features when they sign up. Maybe they just didn’t like the actors in the variation. No matter the reason, our new users were more likely to upload a video (and use more Wistia features) after they watched the 5-minute demo. But the variation video
did receive a much higher engagement rate. If only we could capture the best of both worlds and increase our play rate and engagement rate in our 5-minute demo video. Hmm… ### Follow-up tests As the saying goes, if at first you don’t succeed, pick yourself up and test again. After sharing the results with our video team, we decided to make some changes that we hoped would increase all of our
metrics. Here’s the breakdown:
Play rate: We removed the “Wistia in 5 minutes” text on our thumbnail. Why call attention to the length of the video and distract from friendly faces?
Engagement rate: We edited the video to be shorter—around 3 minutes instead of the original 5.
Upload rate: By making the changes above, we’re hopeful our main metric will improve. In case you’re curious, the most recent version of the edited demo video is below. Stay tuned for the results!
BLOG » STRATEGY
Onboarding New Users With Video
The best onboarding videos demonstrate your product’s benefits and answer your users’ most pressing questions, so they can hit the ground running.

from Wistia Blog
http://ift.tt/1M0PLzM via
video company
from Tumblr http://ift.tt/1NfBwZB
No comments:
Post a Comment