As a video team, we’re interested in view count, yes, but we’re more interested in overall engagement. Did our concept land? Did our message resonate? After we publish our videos, we keep a close eye on our
Engagement Graphs. Sometimes our graphs provide evidence-based pats on the back, while other times, they let us know when something’s not working. This post outlines five public-facing videos, their Engagement Graphs, and our learnings. ### Validation for creative risks
We wanted to launch our Enterprise Plan with a killer video. When we were brainstorming, we kept coming back to the idea of staging a parade in front of our office. It just felt the best. We thought that a one-shot video without any camera motion would be the coolest way to execute our vision. This way, our audience could experience the parade as if they were watching the whole thing from the sidewalk. As we started scripting and planning the video, we knew that we had to hook the audience early. With only one take, we were sacrificing our normal video tricks—multiple shots, creative editing, etc.—so the actual parade had to pique our viewers’ interest in a big way. That meant we couldn’t half-ass it. We needed to go as over-the-top as our little 48-person company would allow, which required tons of time and resources. So after the video launched, we were more curious than usual to see if it worked. And based on the Engagement Graph, it did!
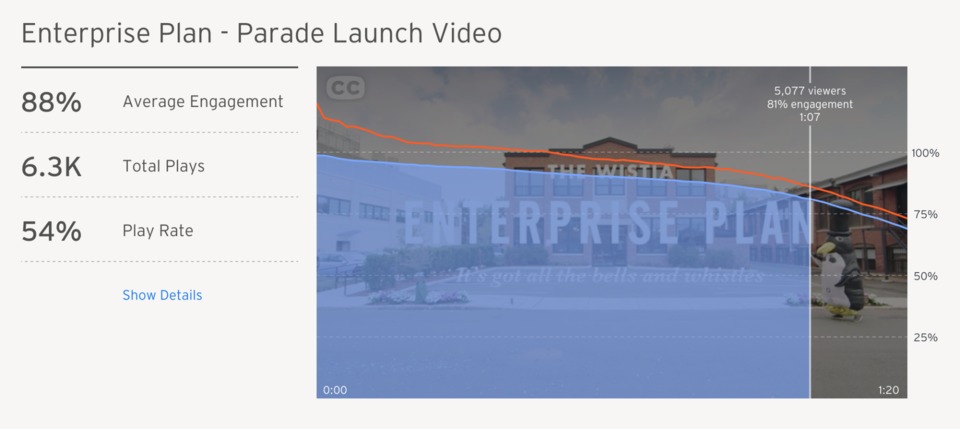
We were able to retain most viewers for the entirety of the video. We started losing people toward the end of the video—turns out people don’t love watching penguins struggle to keep up. This drop-off didn’t bother us because the message had already been delivered, and we didn’t have a
Turnstile email collector or CTA at the end of the video. Being able to point to this successful data has already empowered us to dream a little bigger in our brainstorm sessions. We also maintain a close relationship with
Hot Tamale Brass Band. #### Save-the-date success Turning a save-the-date announcement into a video is tricky, because the message is so simple. There’s a time and a place. That’s about it. When we turned to our trusty Trello board for concept ideas, we noticed the dusty “Wistia Answering Machine” card from 2013, and knew it was finally time.
Since this answering machine concept relies so heavily on compelling audio, it’s easy to see how it got overlooked for the last two years. But a save-the-date video and the answering machine concept were a match made in heaven. When your message is so simple to get across, you’re left with more space to be adventurous with the delivery. We went into the scripting of this concept knowing full well that there would be a high risk of drop off, so we front-loaded the video with the core message. As with the parade video, we took a big departure from our usual style, which is always a little scary. Compared to our other more authentic, people-centric videos, this was an experiment in fictional characters, voice-acting, and visual minimalism. Even though we saw lower engagement than usual for a video of this length, the video still did it’s job.
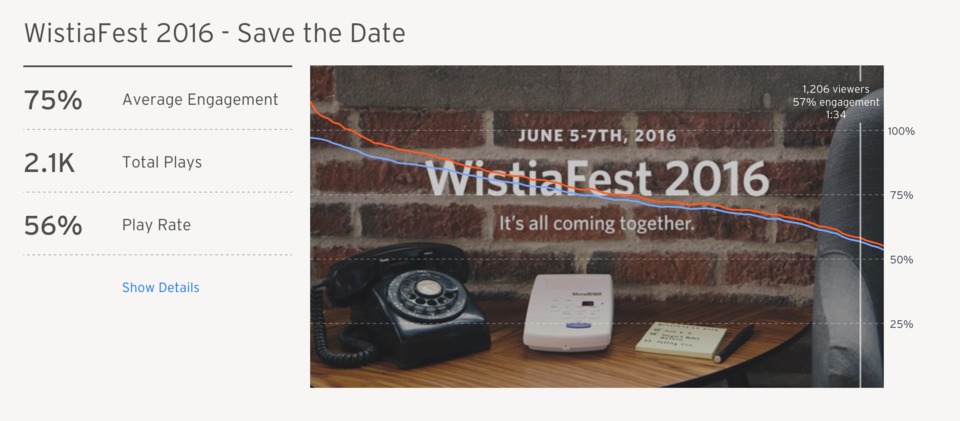
Without looking at the stats, one could argue that we didn’t need to go through the trouble of creating a 1:40-long video to get this simple message across. The design of the landing page, and the first 15 seconds accomplish that. However, this Engagement Graphs shows us that ~1,200 people did stick around to hear the jokes and experience our brand. This data encourages us to take chances. With every new video, you have the chance to delight your audience and create a lasting impression. ### Inspiration for future content
Every so often, we see significant spikes in our Engagement Graphs. In this video about DSLR lenses, we saw a large spike in rewatches when we showed a side-by-side comparison of shots using two different 50mm lenses. With this insight, we were inspired to produce
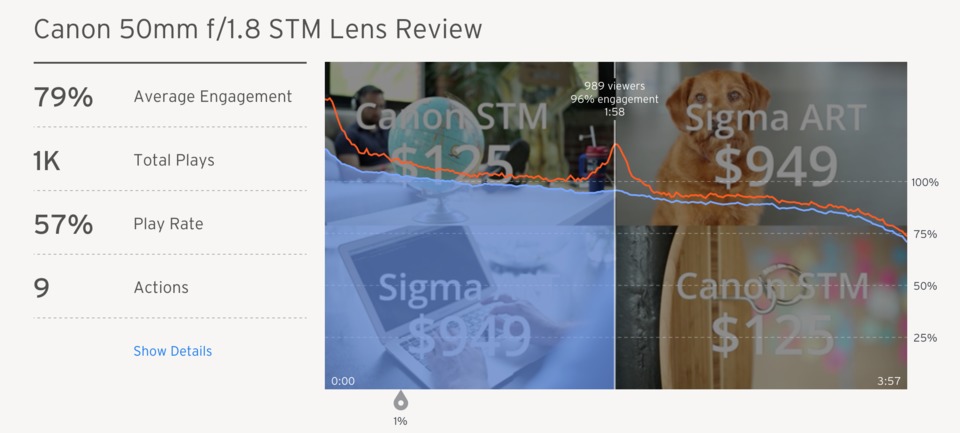
our first gear review video about a new 50mm lens that Canon released—something we had never done before.
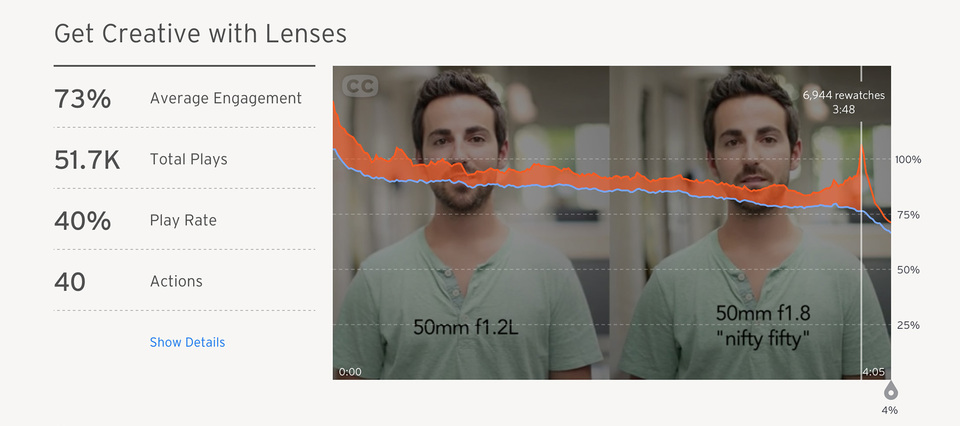
Here’s the kicker: the new video has it’s very own spike! Maybe our audience is telling us that they’d like to see more video content that compares lenses. Maybe they’re trying to get the biggest bang for their buck. Either way, this data helps us focus our efforts on what people actually care about.
### Direction from drop-offs
When we looked back on this video about “Making Better Help Videos,” we weren’t satisfied with the 65% engagement rate. More specifically, we weren’t happy that we lost 3,420 out of 15,328 total viewers in the first 52 seconds. We quickly realized that we needed to cut to the chase. Introductory fluff and context could be included in accompanying text.
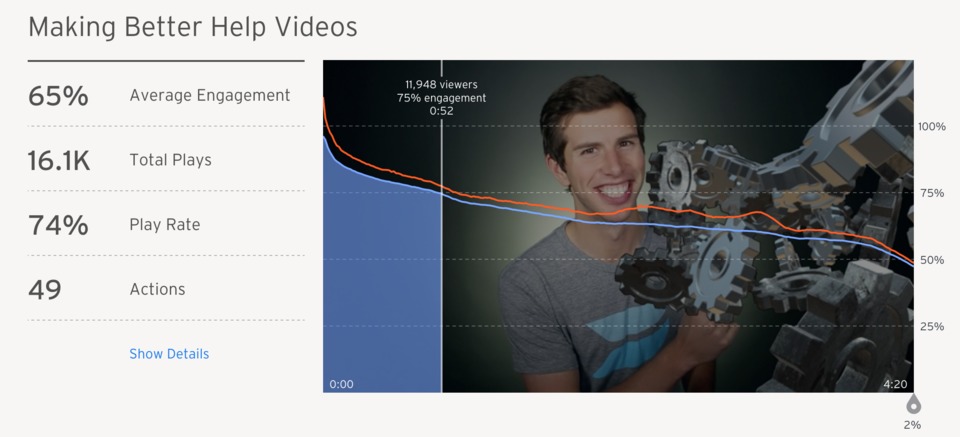
When we redesigned our Library and began to include more text on our video pages, we began scripting differently. Today, our Library videos start with the meat. No time for fluff. We have Engagement Graphs like this to thank for these changes in design, scripting, and production. #### Signing off too soon
There’s a dip at the end of just about every video we’ve made at Wistia, but some are more costly than others. It’s not a huge deal to lose people at the end of your video if they’ve already consumed the message, and you’ve achieved your goal. On the other hand, if you have a Turnstile or a CTA at the end of your video, a dip could translate to less leads. Over time, we’ve learned just how precious every frame is, and we’re very careful about all of our editing decisions. In the video above about lighting for a webcam, I say, “So, there you go” at 1:10. Now, be honest, would you stick around after a line like that?
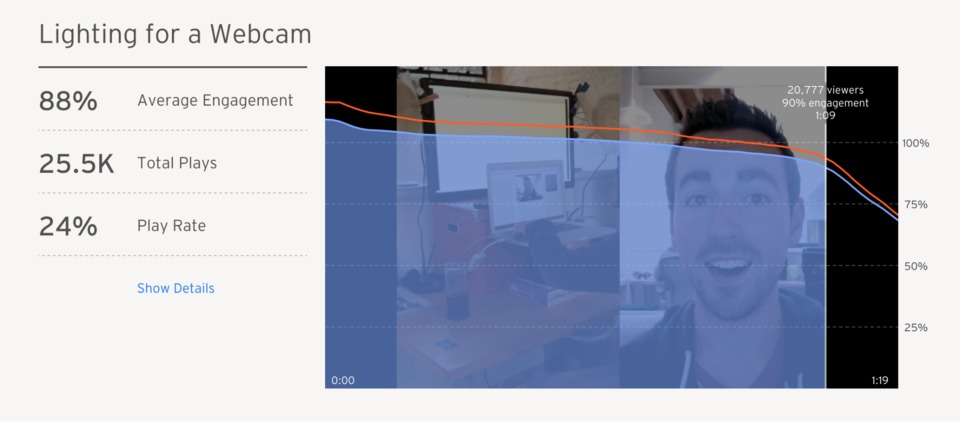
Phrases like “Well, that about does it” (another one of our favorites) signal to the viewers that they’ve already heard the critical information. It may sound obvious, but try to avoid any messaging cues like these until your video is actually wrapping up. You’d be surprised how often these expressions sneak in! #### Logo animation Speaking of engagement dips at the ends of videos, we stopped closing our videos with our logo animation for this reason. After noticing some serious dips, we began hard cutting to a static Wistia logo at the end of our videos. While we sometimes miss that sleek logo build, this concise ending ensures that any CTA or Turnstile we place at the end of a video is seen by folks watching the entire video. It’s a small change with a potentially large impact.
LIBRARY » STRATEGY
Understanding Audience Retention
How to evaluate the strengths and weaknesses of your video by breaking down its analytics

from Wistia Blog
http://ift.tt/1J0CHzS via
production studio
from Tumblr http://ift.tt/1SM4DKb
No comments:
Post a Comment